This started as a show case for Hystrix. As more tools have been added it might also look for you as a walk through for different tools. Take a look around and see what might fit your development environment.
— Alexander Schwartz (alexander.schwartz@gmx.net)
1. Hystrix: Make your application resilient
1.1. Build your application to handle the failure of external services
Your application has external runtime dependencies, like an external validating service for data your user has entered, or the central CRM of your company.
What will happen to your application when this external service has a problem?
In the worst case your application will become unavailable as well: The screens of your application will freeze and not respond as the external system doesn’t return with a response. Users and IT operations will call you because they think it’s your fault and don’t suspect the external service.
But what should your application do, when the external service is unavailable?
-
Provide timely responses to the users.
-
Give a detailed error message to the users.
-
Provide fall backs when the other service is down.
-
Hooks for IT operations for monitoring to pin-point the problematic service.
-
Prevent overloading of the problematic service to avoid domino effects.
-
Automatic recovery once the problematic service is online again.
1.2. What Hystrix has built in ready-to-use
These problems are not new. Netflix has solved them for their video on demand service. In 2012 they made their solution open source.
To deliver the above, Hystrix has built in the following defaults:
-
Timeout for every request to an external system (default: 1000 ms)
-
Limit of concurrent requests for external system (default: 10)
-
Circuit breaker to avoid further requests (default: when more than 50% of all requests fail)
-
Retry of a single request after circuit breaker has triggered (default: every 5 seconds)
-
Interfaces to retrieve runtime information on request and aggregate level (there’s even a ready-to-use realtime dashboard for it)
It also shows you where you can place you fall back code.
Providing a detailed error message is then still a task for you.
For more details please have a look at http://hystrix.github.com. The wiki gives detailed information how to use it and the mechanisms inside.
1.3. Hystrix at work
To seek Hystrix at work in an example application I’ve built a REST application that will be put under load soon. Let’s start out with the scenario first.
2. Prerequisites for this tutorial
2.1. Java SDK installed
In order to run this application you’ll need to have Java installed. The minimum recommended version is Java JDK 7. I have performed my tests with Java JDK 8. Please download it from Oracle Java SE Download page.
2.2. Internet Connection for additional downloads
In the process of the turorial you’ll need to download additional files from the internet. This includes i.e. Apache Tomcat and Apache Maven. All installations are scripted using small Powershell scripts. Expect a download an additional 100 MB during the tutorial.
2.3. Proxy settings
When using Maven behind a proxy, please setup your proxy for protocols http and https in tools\maven\apache-maven-3.2.x\conf\settings.xml. You should specify the username and password only when this is necessary in your configuration. Please leave it blank otherwise. Please ensure that localhost is listed in nonProxyHosts otherwise the automatic deployment to the locally installed tomcat might not work.
<proxy>
  <id>optional</id>
  <active>true</active>
  <protocol>http</protocol>
  <username>proxyuser</username>
  <password>proxypass</password>
  <host>proxy.host.net</host>
  <port>80</port>
  <nonProxyHosts>localhost|local.net|some.host.com</nonProxyHosts>
</proxy>
<proxy>
  <id>optional</id>
  <active>true</active>
  <protocol>http</protocol>
  <username>proxyuser</username>
  <password>proxypass</password>
  <host>proxy.host.net</host>
  <port>80</port>
  <nonProxyHosts>localhost|local.net|some.host.com</nonProxyHosts>
</proxy>
3. Scenario to challenge Hystrix: External Bank validation
3.1. IBAN and BIC validations
Most of Europe have changed to SEPA in early 2014. Instead of national account number and bank sorting code you now have a IBAN (International Bank Account Number) and BIC (Bank Identifier Code).
When customers enter their bank details on your website, you want to validate these. As the IBAN includes a check digit, you can implement this check. The BIC doesn’t have a check digit, so you can only verify it by lookup in a dictionary.
Things get messy as the BIC might not match the IBAN, or the IBAN might not be valid for direct debit/clearing.
The good news: There are external services that do the validation for you.
3.2. Simulating an external IBAN/BIC validation service
As we want to show what Hystrix can do for us, we need a IBAN/BIC validation service. We simulate the behaviour with a small Java procedure:
public class IBANValidator {

    private static Logger LOG = LoggerFactory.getLogger(IBANValidator.class);

    private static DynamicLongProperty timeToWait = DynamicPropertyFactory
            .getInstance().getLongProperty("hystrixdemo.sleep", 100);


    public static synchronized boolean isValid(Account account)
            throws InterruptedException {
        if (Thread.currentThread().isInterrupted()) {
            throw new InterruptedException();
        }
        long t = timeToWait.get();
        LOG.info("waiting {} ms", t);
        if (t > 0) {
            Thread.sleep(t);
        }
        return true;
    }
}
The core of the simulation is the static isValid() method. As it is synchronized, it will validate one account at a time.
To simulate the processing, we use Thread.sleep(). The delay is by default 100 ms. This can be configured at runtime using an DynamicLongProperty. See the chapter Using runtime configuration below. Changing the delay at runtime will help us later to try out different scenarios.
When someone interrupts the thread while waiting for the synchronized lock or for Thread.sleep(), the method will throw an InterruptedException.
This is a standard Java feature that will be used by Hystrix to notify a service call that is taking too long.
You find this source code in the hystrix-application folder.
4. Writing a real application with JAX-RS
4.1. JAX-RS as a standard for enterprise RESTful web application
JAX-RS is part of the JavaEE Standard. It defines how a JavaEE application needs to be structured to respond to HTTP-REST-Calls.
REST calls have the following advantages:
-
With their JSON-interface they can be interfaced easily from JavaScript clients.
-
The REST API can also be easily tested for functional and load testing (see Putting your application under load below).
4.2. RESTeasy as portable JAX-RS implementation
RESTEasy by JBoss is a portable implementation of the standard. It adds also several enterprise features like authentication and signatures.
As a portable implementation I can easily deploy it to a Tomcat application server later.
4.3. Overview of classes to implement a JAX-RS service
You find the example application in the folder hystrix-application.
4.3.1. Application as the starting point
JAX-RS requires you to name all classes related to the REST part of your application. This class needs to extend javax.ws.rs.core.Application:
@ApplicationPath("/api")
public class HystrixApplication extends Application {
    private Set<Object> singletons = new HashSet<Object>();

    public HystrixApplication() {
        singletons.add(new SimpleSaveAccount());
        singletons.add(new HystrixSaveAccount());
        singletons.add(new ValidationExceptionMapper());
        singletons.add(new InterruptedExceptionMapper());
    }

    @Override
    public Set<Object> getSingletons() {
        return singletons;
    }
}
This very basic setup lists the two REST endpoints SimpleSaveAccount and HystrixSaveAccount we will
look at later plus two exception handlers ValidationExceptionMapper and InterruptedExceptionMapper.
It also defines that the URL /api will be used for all JAX-RS requests relative to the application.
4.3.2. SimpleSaveAccount as REST endpoint
JAX-RS requires you to name all classes related to the REST part of your application. This class needs to extend javax.ws.rs.core.Application:
@Path("/simple")
public class SimpleSaveAccount extends AbstractSaveAccount {

    @GET
    @Produces("text/plain")
    public Response hello() {
        return Response.status(Status.OK).entity("Hello world").build();
    }

    @POST
    public Response save(Account account) throws ValidationException,
            InterruptedException {
        if (!IBANValidator.isValid(account)) {
            throw new ValidationException("invalid");
        }
        super.saveToDatabase(account);
        return Response.status(Status.OK).build();
    }
}
This defines for the URL /simple relative to the application defined above how to react on GET and POST requests.
A GET-Request will return with an empty 200 OK response. This enables us to use a simple browser request to test the successful deployment of our application.
A POST-Request will have a parameter of type Account. If the account is invalid, it will throw an exception. Otherwise it will save the account. In our sample application the save operation is a dummy implementation that does nothing. After the save returned, the response is 200 OK.
4.3.3. ExceptionMappers to handle Exceptions
Unhandled exceptions result in the application server to present a standard 500 error page that (depending on the application servers’s configuration) might also include a stack trace of the application.
To avoid this and to return REST-ful error messages exceptions are mapped by an ExceptionMapper.
@Provider
public class ValidationExceptionMapper implements
        ExceptionMapper<ValidationException> {

    @Context
    private HttpHeaders headers;

    @Override
    public Response toResponse(ValidationException e) {
        return Response.status(Status.BAD_REQUEST)
                .entity(new Message(e.getMessage()))
                .type(headers.getMediaType()).build();
    }

}
5. Equip your application with Hystrix
5.1. Ensuring a clean start up and shut down of Hystrix
When you want to run code at the start and at the end of a JEE Web application, the place for this is @WebListener. The servlet container will scan for classes with this annotation and run their contextInitialized() and contextDestroyed() methods.
To start up Hystrix there is nothing to do; you can just go ahead and use it.
I recommend a shut down of Hystrix as it starts several thread pools to do its job. Just add the line
// shutdown all thread pools; waiting a little time for shutdown
Hystrix.reset(1, TimeUnit.SECONDS);
As Hystrix uses Archaius as a default for runtime configuration, we should shut down it as well.
// shutdown configuration listeners that might have been activated by
// Archaius
if (ConfigurationManager.getConfigInstance() instanceof DynamicConfiguration) {
    ((DynamicConfiguration) ConfigurationManager.getConfigInstance())
            .stopLoading();
} else if (ConfigurationManager.getConfigInstance() instanceof ConcurrentCompositeConfiguration) {
    ConcurrentCompositeConfiguration config =
            ((ConcurrentCompositeConfiguration) ConfigurationManager
                    .getConfigInstance());
    for (AbstractConfiguration innerConfig : config.getConfigurations()) {
        if (innerConfig instanceof DynamicConfiguration) {
            ((DynamicConfiguration) innerConfig).stopLoading();
        }
    }
}
5.2. Wrap external interfaces as a Hystrix Command
The core of the application is now set up. To benefit from Hystrix each call needs to be wrapped as a Hystrix command.
private static class IBANValidatorCommand extends HystrixCommand<Boolean> {
    private Account account;

    protected IBANValidatorCommand(Account account) {
        super(Setter.withGroupKey(HystrixCommandGroupKey.Factory
                .asKey("iban")));
        this.account = account; (2)
    }

    @Override
    protected Boolean run() throws Exception {
        return IBANValidator.isValid(account); (3)
    }

}

@POST
@ApiOperation("save account data")
public Response save(Account account) throws ValidationException,
        InterruptedException {
    try {
        if (!new IBANValidatorCommand(account).execute()) { (1)
            throw new ValidationException("invalid");
        }
    } catch (HystrixRuntimeException e) { (4)
        if (e.getCause() instanceof InterruptedException) {
            throw (InterruptedException) e.getCause();
        }
        LOG.error("problem with command: {}", e.getMessage());
        return Response.status(Status.SERVICE_UNAVAILABLE).build();
    }
    super.saveToDatabase(account);
    return Response.status(Status.OK).build();
}| 1 | constructing the wrapper |
| 2 | memorizing the parameters |
| 3 | calling the original code |
| 4 | taking care of the additional runtime exception that originates from an exception of the services, or from the resilience functionality of Hystrix |
When there is a problem with the Hystrix command there will be a HystrixRuntimeException. This will occur in two cases:
-
Hystrix circuit breaker or time out handler are activated.
-
The original command throws an exception.
| If you want to handle the exceptions of your service as before, you will need to unwrap them. |
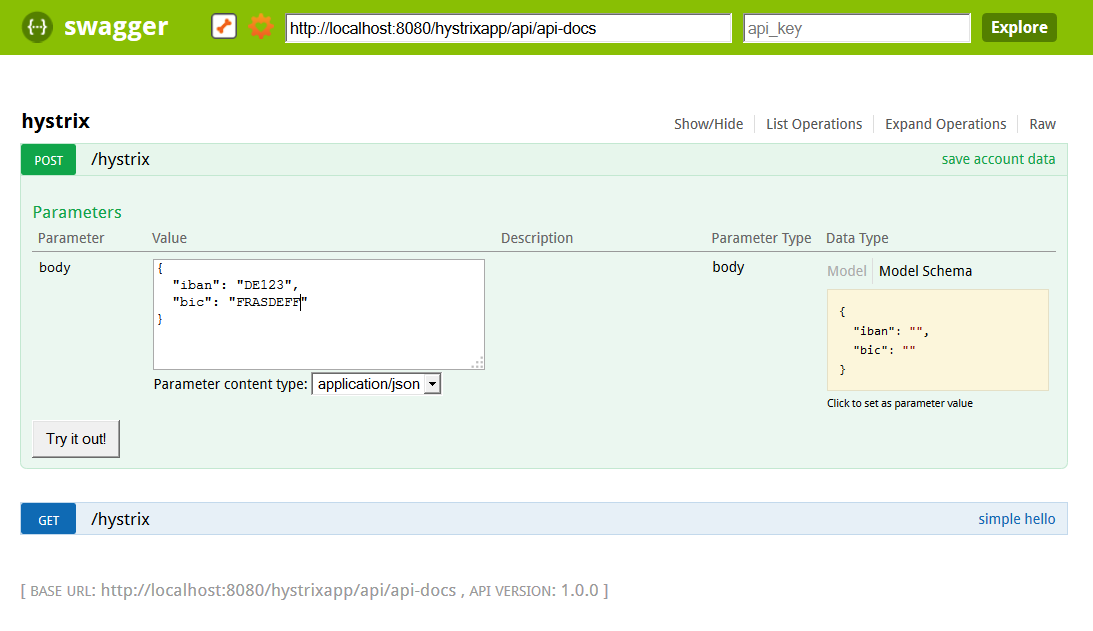
6. Live API documentation
6.1. Swagger creates a live API at runtime
Swagger allows you to annotate your REST endpoints. The information from the JAX-RS annotation and the Swagger annotations is collected at runtime.
6.2. Adding Swagger
To add Swagger to your project, annotate your REST endpoints with @ApiOperation and @Api annotations.
Add the following dependency to your Maven configuration:
<dependency>
    <groupId>com.wordnik</groupId>
    <artifactId>swagger-jaxrs_2.10</artifactId>
    <scope>compile</scope>
    <version>1.3.10</version>
</dependency>
The following snipped is needed in your web configuration:
<context-param>
        <param-name>resteasy.resources</param-name>
        <param-value>com.wordnik.swagger.jaxrs.listing.ApiListingResourceJSON</param-value>
</context-param>
<context-param>
        <param-name>resteasy.providers</param-name>
        <param-value>com.wordnik.swagger.jaxrs.json.JacksonJsonProvider,com.wordnik.swagger.jaxrs.listing.ApiDeclarationProvider,com.wordnik.swagger.jaxrs.listing.ResourceListingProvider</param-value>
</context-param>
<servlet>
        <servlet-name>DefaultJaxrsConfig</servlet-name>
        <servlet-class>com.wordnik.swagger.jaxrs.config.DefaultJaxrsConfig</servlet-class>
        <init-param>
                <param-name>api.version</param-name>
                <param-value>1.0.0</param-value>
        </init-param>
        <init-param>
                <param-name>swagger.api.basepath</param-name>
                <param-value>http://localhost:8080/hystrixapp/api</param-value>
        </init-param>
        <load-on-startup>2</load-on-startup>
</servlet>
6.3. Accessing the Live API
The Live API will be deployed as part of the application. You can access it with your browser using the following URL: http://localhost:8080/hystrixapp/swagger/
7. Starting up the application container
7.1. Apache Tomcat is is an easy to use servlet container
Apache Tomcat is a servlet container. It can run JavaEE Web applications like our JAX-RS applications.
Tomcat Version 8 is implementing the JavaEE 7 standard supporting the latest APIs.
7.2. Installing and running Apache Tomcat
Installation is straight forward: After the download only few configuration steps are necessary.
All of these have been prepared in the script tools/tomcat/run-tomcat.bat. When you start it the first time, the the script will download the installation archive, unzip it and update the configuration.
7.2.1. Activated Apache Tomcat features
The following features are being set up using the automatic installation:
In setenv.bat:
-
Allow Java remote debugging on port 1044
-Xdebug -Xrunjdwp:transport=dt_socket,server=y,suspend=n,address=1044
In context.xml:
-
Activate
antiResourceLockingto allow hot-deployment of applications when running Microsoft Windows as operating system
In tomcat-users.xml:
-
Setup an user
deploywith passworddeployto automatically deploy an application. -
Setup an user
tomcatwith passwordtomcatto allow login on the management GUI.
7.2.2. Testing the Apache Tomcat installation
To test the application point your browser at http://localhost:8080. You should see an Apache Tomcat start page with the welcome message (see figure Apache Tomcat Welcome Message).
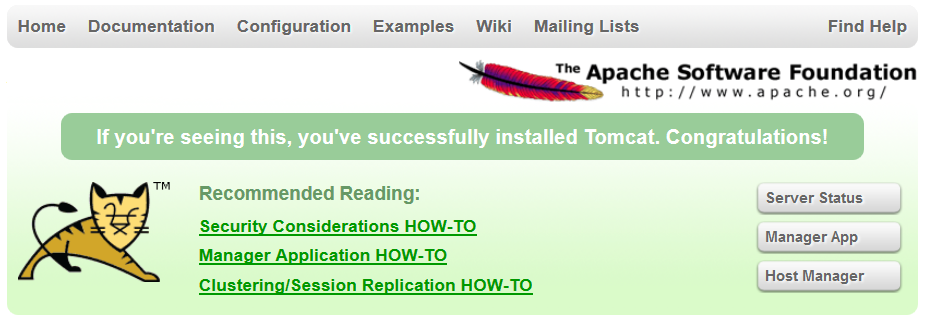
Click on the button Manager App and you will be asked for a user name and password. Use the user tomcat with the password stated above to log in.
8. Using runtime configuration
8.1. Runtime configuration will get you credits
If you would write applications that would require a restart every time you change a setting, it will deter your users as you will have a downtime.
How nice if you could change all your settings at runtime! No more night shifts for IT operating to change parameters and restart the services!
8.2. Netflix Archaius to the rescue
Hystrix is integrated already with Archaius that handles runtime
configuration for you. When implementing IBANValidator you’ve seen the dynamic property being introduced:
private static DynamicLongProperty timeToWait = DynamicPropertyFactory
        .getInstance().getLongProperty("hystrixdemo.sleep", 100);
This will create a dynamic property. When it’s being accessed, it will always return the most up to date value for it. When the external configuration doesn’t define a value the default of 100 will be returned.
In more advanced situations you can also register a callback to be notified whenever a configuration changes. Please refer to the Archaius Wiki to find out more about it.
8.3. How runtime configuration works in this project
Archaius supports multiple back ends to store configuration data. In this setup all configuration is stored in a Java properties file. Archaius checks this file every second.
This is configured as follows:
-Darchaius.configurationSource.additionalUrls=file:///%CATALINA_HOME%/../archaius.properties
-Darchaius.fixedDelayPollingScheduler.delayMills=1000
-Darchaius.fixedDelayPollingScheduler.initialDelayMills=1000
This allows you to change the dynamic:
hystrixdemo.sleep=10This will override the default setting with 10.
8.4. Configuring the Hystrix command via Archaius
All Hystrix settings can be configured on default and on command level. Please refer to the Configuration Wiki of Hystrix for an in-depth discussion. This will now show the core parameters and configure them on default level:
# Should Hystrix interrupt a command that is overdue?
# default: true
hystrix.command.default.execution.isolation.thread.interruptOnTimeout=true

# How many errors are allowed before the circuit breaker is activated?
# default: 50 (must be greater than 0,
# 100 means no breaking despite of errors)
hystrix.command.default.circuitBreaker.errorThresholdPercentage=50

# How many requests are needed in the time span to trigger the circuit breaker?
# default: 20
hystrix.command.default.circuitBreaker.requestVolumeThreshold=20

# After what time (in ms) should the circuit breaker try a single request?
# default: 5000
hystrix.command.default.circuitBreaker.sleepWindowInMilliseconds=5000
To give these parameters a try you should set up a load test. You’ll see in the next chapter how you can do this. But first deploy the application to this freshly installed Tomcat!
9. Building and deploying the application
9.1. Build Configuration based on conventions with Apache Maven
Apache Maven as a build system you the following advantages:
-
Project layout based on conventions (i.e. your source files are in
src/main/java) -
Management of binary artefacts including transitive dependencies
-
A lot of plugins to automate your build
9.2. Installing Apache Maven
This process has been automated for you, as all projects include Maven Wrapper. This will download and install maven automatically.
9.3. Packaging and deploying your application to Apache Tomcat
To do this run hystrix-application/maven-package-deploy. Please ensure that your Apache Tomcat is running, as Maven will deploy your application into the running Apache Tomcat.
The steps executed by Maven mvn clean package cargo:redeploy included in the Batch-file:
-
Clean up the build folder
target, -
download all dependencies from public Maven repositories if they haven’t been downloaded yet,
(this might take a while on the first run depending on the speed of your Internet connection) -
compile all Java sources,
-
package a WAR file in the
targetfolder, -
deploy it to your running Tomcat instance.
To test that your application has been deployed successfully, open the URL http://localhost:8080/hystrixapp/api/simple in your browser.
You should get the response Hello world to show you that everything has been set up correctly.
10. Putting your application under load
10.1. Apache JMeter is free and open source load testing
Apache JMeter allows you to create and run load tests simulating the load of multiple users using a single PC.
10.2. Installing Apache JMeter
This process has been automated for you. The first time you start tools/maven/run-jmeter.bat JMeter is downloaded and installed.
The following defaults are applied:
-
Whenever you run JMeter using the script above, the load testing script
hystrixSaveAccount.jmxis opened.
You will see the Apache JMeter Start Screen.
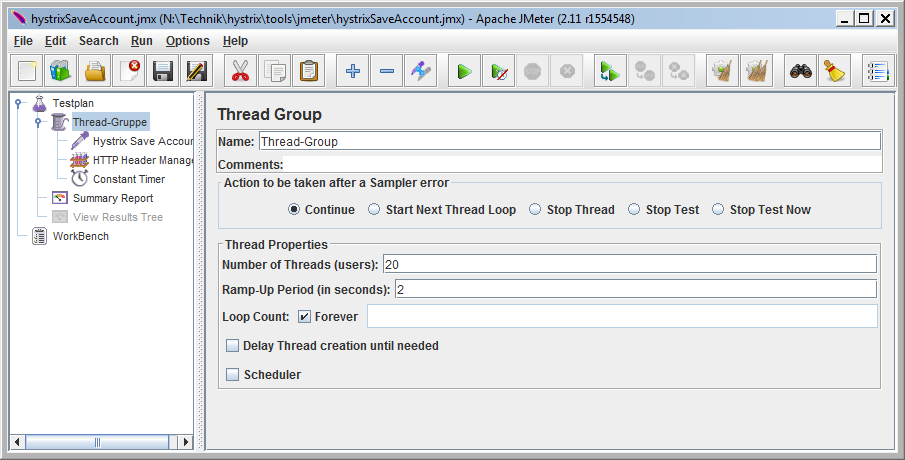
10.3. Simulating multiple users
You can vary the number of simulated users by changing the number of threads. In this script the number of users is configured to be 20.
A test with JMeter has the following steps:
-
choose the number of users (aka threads)
-
press the play
 button to start the workers
 -
press the stop
 button to stop the workers
 -
Watch the summary report to see the timing of the requests and how many requests succeed and fail
-
Watch the log file of Apache Tomcat for exceptions and other log messages
-
Change the Archaius runtime configuration and see how the behaviour of the system changes (see section Using runtime configuration for the details).
-
press the clean
 button to clear the results from JMeter
| When you change the number of users (aka threads) it will become effective only after you stop/start the workers. |
11. Aggregating Hystrix runtime information in a cluster
11.1. Turbine aggregates runtime information
Netflix Turbine is a web application that connects to instances of your Hystrix application in a cluster and aggregates the information.
It does this in real time. The results will be updated every 0.5 seconds.
11.2. Installing and running Turbine
The installation has been scripted for you: You need to run tools/turbine/maven-package-deploy.bat.
The current installation will re-package the 0.4 version of Turbine and add to it the latest (yet unreleased) changes to allow easy re-deployment. Please have a look into pom.xml to see how you can adopt an already packaged WAR file to your environment.
You can open the URL http://localhost:8080/turbine/turbine.stream in a Google Chrome browser to see the stream of events. If there are no Hystrix requests, you’ll see only "ping" messages. You can’t test this with Mozilla Firefox or Microsoft Internet Explorer as they will open only a file download dialogue.
11.3. Configuration for Turbine
11.3.1. Configuration Turbine metadata
Turbine uses the same configuration mechanism as Hystrix: Archaius. See chapter "Using runtime configuration for more information. The following configuration has already been set up for you in archaius.properties:
turbine.instanceUrlSuffix=:8080/hystrixapp/hystrix.stream
turbine.ConfigPropertyBasedDiscovery.default.instances=localhost
turbine.ConfigPropertyBasedDiscovery.localhost.instances=localhostturbine.instanceUrlSuffix: This URL suffix needs to be the same for all applications in the cluster. Turbine uses this endpoint to receive a stream of runtime information.
turbine.ConfigPropertyBasedDiscovery.default.instances: This lists the hosts Turbine should poll information from. In a production system there are mechanisms to discover hosts automatically. In our test scenario a list is sufficient as we have only one host.
11.3.2. Preparing your application for Turbine
To have your application publishing the information on the URL suffix above, you’ll need to add a servlet to your application. This has already been packaged for you. You’ll just need to include as a dependency of your application in pom.xml:
<!-- include metrics event stream -->
<dependency>
    <groupId>com.netflix.hystrix</groupId>
    <artifactId>hystrix-metrics-event-stream</artifactId>
    <version>${hystrix}</version>
</dependency>
Then you register it in web.xml as a servlet:
<!-- include metrics event stream -->
<servlet>
        <description></description>
        <display-name>HystrixMetricsStreamServlet</display-name>
        <servlet-name>HystrixMetricsStreamServlet</servlet-name>
        <servlet-class>com.netflix.hystrix.contrib.metrics.eventstream.HystrixMetricsStreamServlet</servlet-class>
</servlet>
You can open the URL http://localhost:8080/hystrixapp/hystrix.stream in a Google Chrome browser to see the stream of events. If there are no Hystrix requests, you’ll see only "ping" messages. You can’t test this with Mozilla Firefox or Microsoft Internet Explorer as they will open only a file download dialogue.
To visualize it, see the next chapter about Hystrix dashboard.
12. Displaying Hystrix runtime information in a browser
12.1. Hystrix Dashboard displays a Realtime Dashboard
Hystrix Dashboard is part of the Hystrix distribution. It displays runtime information about every Hystrix command and thread pool for the last few minutes.
12.2. Installing and running Hystrix Dashboard
The installation has been scripted: you need to run tools/hystrix-dashboard/maven-package-deploy.
Open your browser on http://localhost:8080/hystrix-dashboard/. Press Monitor Stream with the default setting to display the aggregated stream from the Turbine dashboard.
Enter http://localhost:8080/hystrixapp/hystrix.stream to retrieve the information from the application directly.
13. Behaviour of Hystrix under load
13.1. Introduction to Load Scenarios for Hystrix
Now we have a complete setup: an application, a driver for the load and a real time dashboard. You are now ready to see the behaviour of Hystrix.
The number of threads in JMeter will remain constant for all scenarios. The scenarios will differ only in their setting of hystrixdemo.sleep in archaius.properties. This will simulate an IBAN/BIC validation that is gradually getting slower and slower.
The delay between requests in the thread pool is 1 second. The time of the service to respond is not compensated by the delay: The longer the response time is, the fewer requests per second we will see. When there is no delay at all, we would see 20 requests per second, as we have 20 workers.
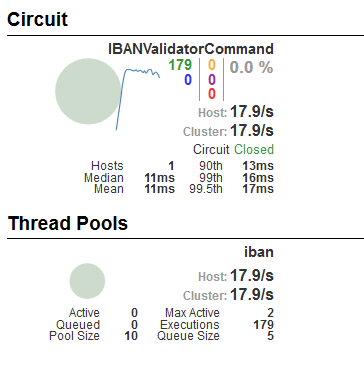
13.2. A fast response: 10 ms
Starting with a response time of 10 ms we see a very well behaving system: The throughput is about 18 requests per second.
The number of active threads is idling between one and two. The median service time is about 10 ms, the mean slightly above.
13.3. A medium response: 70 ms
Now change the delay to 70 ms. Save the file. Archaius will pick up the new value within a second. Our IBAN/BIC service will get slower.
You will see an immediate effect on the Dashboard. After a short time the values in the dashboard will be re-calculated.
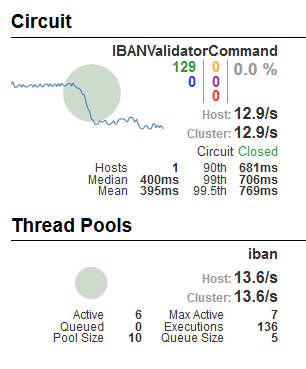
With 13.6 requests per second and a delay of 70 ms in the service is now saturated. 13.7 req/s multiplied with 70 ms is almost 1 second working time per second.
You also see that the number of active threads has increased to 6.
13.4. A late response: 100 ms
Change the delay to 100 ms. Save the file. You’ll see the dashboard change.
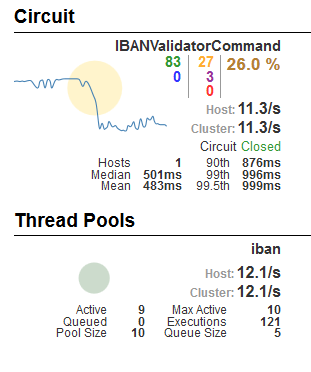
The number of active threads iterates between 9 and 10. (Please ignore the "queue size", this is not active as queueing is disabled by default). Indicated as a yellow number some requests receive a time out while they are waiting at the synchronized lock on the simulated IBAN server. Purple indicates the number of requests that are rejected when there is no space in the queue.
The dashboard shows you that 26 percent of all requests fail.
If the service wouldn’t have been wrapped as a service, we would see an overload situation and with long response times. With Hystrix the response times in the 99 percent tier are still around one second for the successful requests.
The circuit is closed, meaning that Hystrix considers the service to be functional (although some requests are rejected).
13.5. A critical response: 200 ms
Now try 200 ms. Save the file. The dashboard will change again.
You’ll see that the Circuit changes between open and closed. Therefore the following picture is a combination of two screen shots.
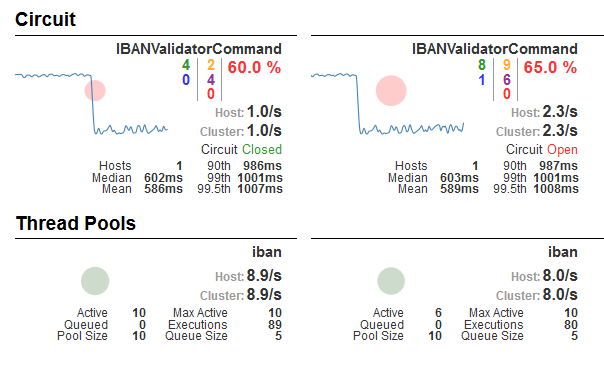
The ratio of failed commands is now more than 50 percent, therefore the circuit breaker kicks in. Every five seconds it tries on request (that is answered within 200 ms), resets the statistics and then closes again.
As the statistics are reset on each opening circuit, you can’t trust the dashboard. Please have a look in JMeter in the Summary report. Reset it (as it will by now contain results from the previous setups) and wait a short time. It will show you that about 65 percent of the requests fail.
13.6. An eternity: 1500 ms
The final setting: 1500 ms. Save the file. Watch the dashboard.
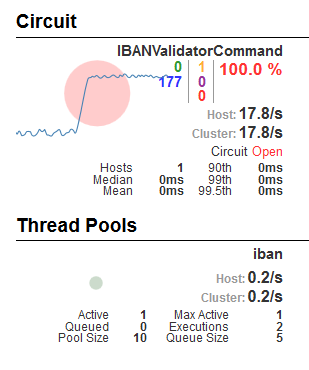
As the time out is 1000 ms for the commands, 100 percent of the requests fail. The circuit is now permanently open. Even the retry every 5 seconds will not close it again as this single request is too slow.
13.7. Hystrix: Don’t waste resources by queueing requests
The examples show that Hystrix does its job very effectively:
-
It will forward as many requests as possible to the service to process them.
-
Any other requests are returned to the sender as unsuccessful as early as possible.
-
No caller waits longer than the 1 second time out for a response.
-
Queues require resources and Hystrix efficiently minimizes queueing inside the system. It is limited by default to ten concurrent requests processed by the thread pool.
-
A burst in requests is reflected at the earliest boundary instead of overloading the backend service.
-
When the back end services are overloaded for one or the other reason, the circuit breaker in front will give the backend services a break to recover.
Well done, Hystrix!
Please feel free to try your own variations: enable queueing, change the number of threads, or try out any other Hystrix setting.
14. Long term monitoring of Hystrix metrics
14.1. Zabbix as classic long term monitoring and notification
Zabbix is a classic monitoring system. It is stable and it has grown over several iterations. It supports a REST API out of the box.
All data is stored in a database. The server polls information from clients, runs commands or receives information from agents.
A frontend service will provide a web interface that includes configuration, monitoring and graphing capabilities.
14.2. Installing and running Zabbix
The installation has been scripted as a Vagrant script. This will first download a linux image of CentOS and spin it up in Virtualbox. Then it will hand over to a provisioner, in our case this is Saltstack.
To install Vagrant please see Running virtual machines for test and development. Once it is installed,
run the follwing command in tools/zabbix:
vagrant up
This will take a while to download all the files necessary. Once it is up and running point your browser at your local Zabbix installation: http://localhost:2280/zabbix.
Use Username Admin password zabbix to log in (please note the capital A in the user name)
14.3. Configuration of Zabbix
All configuration items could be automated using the REST API. This will be a future task for this tutorial.
For now these are the manual steps:
-
In click on Import. Pick the file
hystrix_template.xmlfromtools\zabbix. Click on Import. -
Choose again. You see a
hystrixTemplatehere. Click on this template to edit it. Include the hosthystrixin groupDiscovered Hostsin the shuttle view to put it on the left side. This will apply the template to the host. Click on Save. -
In click on Create Host. Enter
hystrixas host name here. PickDiscovered Hostsas the Host group. Now Save.
This is all configuration that is needed: You have created a host, and you have associated it with a template that will autodiscover all Hystrix comamnds.
14.4. Configuration of the example application
As default the Zabbix agent in the application is disabled. To enable it, go to the file archaius.properties. Change the hystrixdemo.enablezabbix to be true.
The change is active at runtime. This will trigger the activation in HystrixSetupListener.
14.5. Zabbix autodiscovery at work
The following steps will now happen automatically:
-
The Zabbix agent will connect to
127.0.0.1:10051and identifies itself as hosthystrix. In our example this is hardcoded. -
The Zabbix agent asks the server for any scheduled checks. The only check that is configured for the host
hystrixis thehystrixCommand.discoveryin the template. -
The agent runs the check and delivers all active Hystrix commands as a JSON object to the server.
-
This will trigger the auto discovery. For every command Zabbix will create 20 items and three graphs.
-
When the Zabbix agent reloads the list of checks after a minute, there will be a lot more checks. It will run them as specified in the interval of the template we imported to Zabbix.
The auto discovery rule is set to run every five seconds. Please note that the auto discovery will only find commands that have been triggered at least once during the runtime of the application. Hystrix will only notify our Zabbix agent at the first created command.
Please choose and you should see the number of Items change for the host hystrix. Please refresh your browser if necessary.
Now choose and choose the host hystrix and any of the three graphs. After a few minutes you should see the first graphs appearing. The following screen shows a service that was answering successfully first. After a short time the response time was changed to 250 ms. Soon lots of rejected and timeout requests appear.
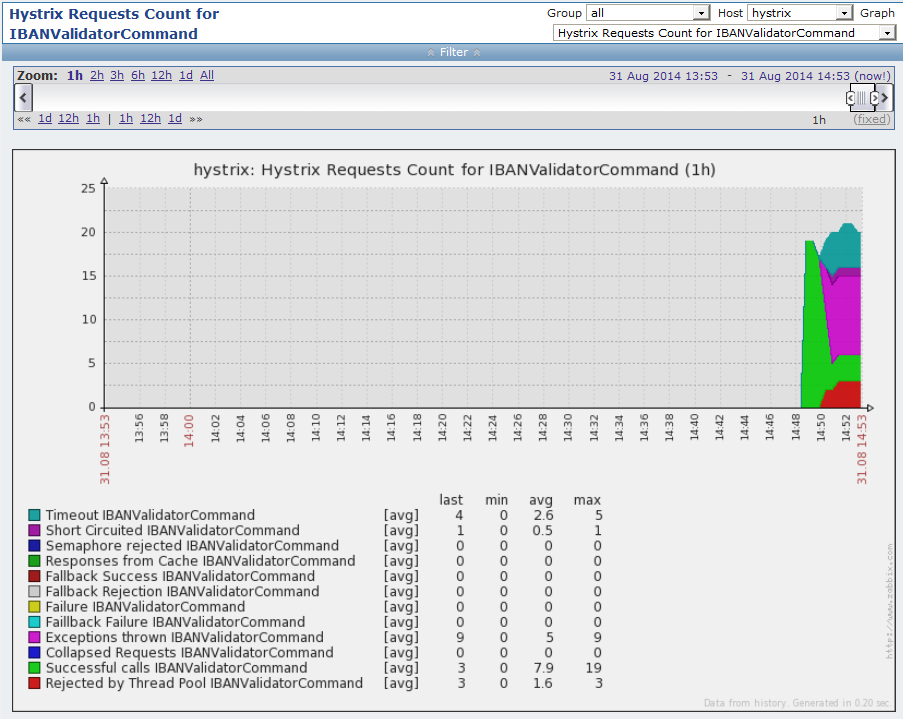
Zabbix polls for the command data every minute. Change the timing in archaius.properties to see information about failed requests.
Click on to see the latest values that the agent has sent.
14.6. Java classes to forward information from Hystrix to Zabbix
In order to activate the forwarding of events, you’ll need to change hystrixdemo.enablezabbix to true in archaius.properties.
This change will be active immediately.
The property hystrixdemo.enablezabbix in archaius.properties is evaluated in the class HystrixSetupListener. When this property is enabled, the Zabbix agent is started.
You find all additional classes in the package de.ahus1.hystrix.util.zabbix in the example application. The following classes work together to forward the information to Zabbix:
-
ZabbixCommandMetricsProvideris registered with Zabbix. It handles the connection to Zabbix. It creates a callbackZabbixCommandMetricsProviderthat will be called by the agent when it requires data for the providerhystrixCommand. It creates for Zabbix on request aHystrixZabbixMetricsPublisherCommandwhen a command is created for the first time. -
Once the
HystrixZabbixMetricsPublisherCommandinitialized, it registers itself with theZabbixCommandMetricsProvider. -
The
ZabbixCommandMetricsProviderwill provide a list of HystrixCommand keys when it is called withhystrixCommand.discoveryWhen it is calledhystrixCommand.countSuccess[{#COMMAND}]it returns the current count of successful Hystrix command calls.
The current implementation doesn’t return any information about thread pools yet.
14.7. Working with templates in Zabbix
When you change your template, the changes are applied to all hosts assigned to the template. This makes it easy to ensure a common configuration of all Hystrix commands throughout your infrastructure.
You can also choose to setup triggers automatically.
When a command is no longer used in your application, the auto discovery will no longer return it to Hystrix. Hystrix will remove all items that are no longer needed after 30 days. You can simulate this behaviour by stopping/starting the tomcat server and not sending any requests via JMeter. As now commands will be triggered, the list of auto-discovered commands is empty. A few seconds later Zabbix will add a yellow exclamation mark to your items and will start the 30 day countdown.
15. Real time monitoring of Hystrix metrics
15.1. Riemann as cutting edge realtime event processing
Riemann is a a modern event management system. It has been designed with with performance in mind for montoring complex systems. To process the data fast it keeps the last few minutes of data in memory. All events are processed in a streaming mode.
The events can be aggregated and filtered. You can also start actions like notifying IT operations of problems.
Riemann comes with its own dashboard that can show you can use to show real time graphs and statistics.
So far both the Hystrix Dashboard and Zabbix have been presented. You could consider Riemann for the following:
-
Zabbix polls existing metrics from Hystrix. You can aggregate events to deliver your own metrics using Riemann. This all happens outside of the application. This gives you a lot of flexibility.
-
While the Hystrix Dashboard is a great start for a dashboard, it is not configurable. The Riemann Dashboard is highly configurable (once you understand its keyboard shortcuts) and might delivery you additional insights you might need to administer your cluster.
-
Assuming that Zabbix receives information every minute, this means that you will receive alerts with a delay of one minute. After a problem disappeared (for example after you have restarted a service, or fixed a configuration problem) you will see this only after a minute or two in the Zabbix graphs. Riemann gives you the options to be notified immediately by a channel of your choice (email, SMS, chat) when the problem occurs and when it is fixed.
Filtered events can be forwarded to systems like InfluxDB to be stored. These can be displayed later using tools like Grafana. But lets start with Riemann first.
15.2. Installing and running Riemann
The installation has been scripted as a Vagrant script. This will first download a linux image of CentOS and spin it up in Virtualbox. Then it will hand over to a provisioner, in our case this is Saltstack.
To install Vagrant please see Running virtual machines for test and development. Once it is installed,
run the follwing command in tools/riemann:
vagrant up
This will take a while to download all the files necessary. Once it is up and running point your browser at your local Riemann installation: http://localhost:4567/.
15.3. How Events are captures for Riemann
In the example application the HystrixSetupListener registers the class HystrixRiemannEventNotifier with Hystrix. This will be notified with the detailed timinings of each run command and with the outcome of each command (successful, timeout, etc.).
These events are queued in a bounded queue. The result will be forwarded to Riemann in batches every 100 ms.
In order to activate the forwarding of events, you’ll need to change hystrixdemo.enableriemann to true in archaius.properties.
This change will be active immediately.
15.4. Configuring Riemann Server
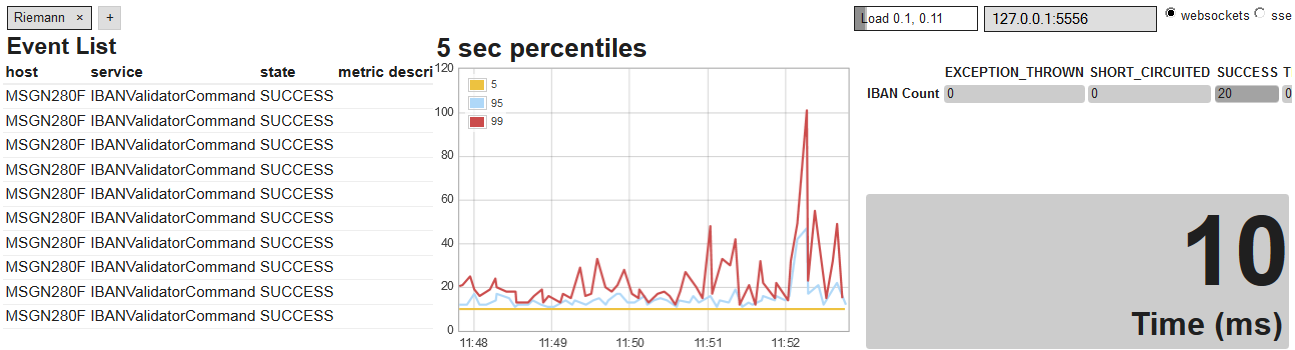
In this setup the information about Hystrix commands is forwarded on a level of a single command execution.
We can present it on this level, but usually you want to create aggreation on top of the event stream. The first listing aggregates the timings of the service IBANValidatorCommand.
(let [index (index)]
  (streams
    (where (and (= service "IBANValidatorCommand") (not (= metric nil)) )

       ; Now, we'll calculate the 50th, 95th, and 99th percentile for all
       ; requests in each 5-second interval.

       (percentiles 5 [0.5 0.95 0.99]

           ; Percentiles will emit events like
           ; {:service "api req 0.5" :metric 0.12}
                   ; We'll add them to the index, so they can show up
           ; on our dashboard.

           index)
    )
  )
)
The second listing counts the different outcomes (SUCCESS, TIMEOUT, etc.) in every five second interval. This statement contains a statement for logging the aggregated events in the Riemann server log.
(let [index (index)]
  (streams
    (where (and (= service "IBANValidatorCommand") (= metric nil) )

      (by :state
        (with :metric 1 (with :service "IBAN Count"
          (rate 5
          ; log all events (for debugging)
          #(info "received event" %)
            index
          )
        ))
      )

    )
  )
)
15.5. Configuring Riemann Dashboard
You can configure the frontend of Riemann in your browser. This setup installs a dashboard that shows some useful information about the example application.
In the lower part of the screen you will see a guide how to use keyboard shortcuts to customize the dashboard.
As with the Zabbix monitoring, this will only show useful information once some commands are run. Please use the JMeter load test for this.
Appendix
16. Writing an online manual
16.1. Asciidoctor is a lean tool for technical documentation
This manual is written in Asciidoc format. Asciidoctor is used to create an online documentation from it.
To find out more about Asciidoctor see the http://asciidoctor.org/. It is a clone of the original Asciidoc using Ruby. Compiled versions are available for Java and JavaScript. This allows you to easily integrate it into your build process.
You can create from a single source of documentation formats like HTML5, PDF and epub.
16.2. Editors to work on Asciidoctor
Asciidoctor files are plain text files with an easy to learn syntax. You can use any text editor to write the files.
You might want to try the Asciidoctor preview plugin and Asciidoctor language plugin for GitHub’s Atom editor. As the time of writing this provides you the best authoring experience.
17. Running virtual machines for test and development
17.1. Vagrant manages virtual machines
Virtual machines make development and test easier, as they can be started and stoped as you need them. You re-use the CPU, RAM and hard disk space on your PC. When you don’t need them you shut them down and they will use only some hard drive space. Once your test or development are over you can wipe them from your hard disk.
A software to provide this virtualization is the free Oracle’s Virtualbox. You can spin up as many machines as you have RAM, CPU and hard disk space on your local machine. You can set up custom networking and interact with the machines either via screen or network.
But setting up a test environment would still be a manual process if you would use only Virtualbox. Vagrant builds on top of it and provides a command line and scripting for you. It also allows you to create local test instances from centrally managed ready made boxes, so you don’t need to install an operating system manually.
17.2. Installing Vagrant and useful plugins
To use Vagrant please use the following steps:
-
Download and install Oracle’s Virtualbox from http://virtualbox.org/.
-
Download and install Hashicorp’s Vagrant from http://vagrantup.com.
-
Install the Vagrant Cachier Plugin (https://github.com/fgrehm/vagrant-cachier) to cache all downloaded software packages locally. This will speed up future installations. Do this by starting from the command line:
vagrant plugin install vagrant-cachier
-
Install the Vagrant Guest Additions Plugin (https://github.com/dotless-de/vagrant-vbguest) to be able to update the virtual box tools on the downloaded images automatically. Do this by starting from the command line:
vagrant plugin install vagrant-vbguest
-
Install the Vagrant proxy plugin (https://github.com/tmatilai/vagrant-proxyconf) to configure the downloaded image automatically regarding its proxy settings. Do this by starting from the command line
vagrant plugin install vagrant-proxyconf
17.3. Proxy configuration for Vagrant
To be able to install any vagrant plugin behind a proxy, set the http_proxy environment variable. The this syntax assumes you are running a Microsoft Windows system:
SET HTTP_PROXY="http://username:password@proxyhost:proxyport/
SET HTTPS_PROXY="http://username:password@proxyhost:proxyport/
Vagrant will not re-use your system’s proxy settings. You’ll need to specify them again.
I recommend that you set up a common configuration for all your boxes (not individually for each box). Create (or ammend) the file Vagrantfile in your %USERPROFILE%\.vagrant.d folder.
# URI of the local (caching) HTTP proxy
# LOCAL_HTTP_PROXY = 'http://proxyhost:proxyport'
LOCAL_HTTP_PROXY =

# Configures vagrant-cachier and vagrant-proxyconf.
# Should be called only on "local machine" providers.
def configure_caching(config)
  if Vagrant.has_plugin?('vagrant-cachier')
    config.cache.enable :gem
    config.cache.enable :npm
  end

  if Vagrant.has_plugin?('vagrant-proxyconf')
    config.proxy.http     = LOCAL_HTTP_PROXY
    config.proxy.https    = LOCAL_HTTP_PROXY
    config.proxy.no_proxy = 'localhost,127.0.0.1'
  end
end

Vagrant.configure('2') do |config|
  config.vm.provider :virtualbox do |vbox, override|
    configure_caching(override)
  end
end
Alternatively you can set the environment variables VAGRANT_HTTP_PROXY, VAGRANT_HTTPS_PROXY and VAGRANT_NO_PROXY.
17.4. Managing virtual machines from the command line
You can start a box with:
vagrant up
You can stop a box with:
vagrant suspend
You can log in to the box using:
vagrant ssh
For a list of other commands start
vagrant -h
By default a user vagrant with password vagrant exists every machine. You can use ssh to access a console. From the vagrant user you can use the sudo command to acquire root access.
18. Automatic provisioning of machines
18.1. Saltstack installation automation
In order to provide reproducable and easy to setup development and test environments, you can script the installation of the software.
There are different tools available to install and configure software once the base operating system is installed. Some of the tools used for this are Chef, Puppet, Saltstack and Ansible.
I’ve chosen Saltstack here as it concentrates on its task to install and configure software - nothing more. For this it takes input as simple YAML files with only very little scripting.
Vagrant already knowns about different provisioners, also about Saltstack. To hand over control to Saltstack only the following few lines are necessary in the Vagrantfile of the virtual machine you want to provision:
config.vm.provision :salt do |salt|
  salt.minion_config = "salt/minion"
  salt.run_highstate = true
end
Vagrant will first check if Saltstack is already installed on the virtual machine. If not, it will install the latest version of Saltstack. Once this is complete it hands over control to Saltstack to install all the configured packages.
To find out more about Saltstack please visit its website http://saltstack.com.
18.2. Running Saltstack in standalone mode
Saltstack can be run in two modes:
-
Centrally managed configuration: a master server stores all configuration and passes it to the clients (the clients are called "minions").
-
Locally stored configuration: A client will have all configuration files necessary stored locally. This setup is called "masterless" setup.
The scripts will not differ in the two setups. But it simlifies development and also the setup we use here to have a masterless setup. To do this, I specied file_client: local in the minion file.
(Note: this masterless setup is not unique to Saltstack, it is also available for other provisioning tools.)
18.3. Configuration files for automatic installation
You will find the configuration files in salt/roots/salt. They are plain text files. You can open them in a plain text editor to get a first impression. Please refer to the Salstack documentation find out more.
18.4. Saltstack commands
Provisioning via saltstack is run automatically. To run salt stack provisioning manually again (for example after you have changed a configuration file) use the following command as user root:
salt-call --local state.highstate
Please refer to the Salstack documentation find out more.
19. Building the documentation automatically
19.1. Things that need maintenance
This manual is written in Asciidoc format. Asciidoctor is used to create an online documentation from it.
This can be done manually by calling manual/build.bat. The changes then need to be published to the gh-pages branch.
To find out more about Asciidoc and Asciidoctor see see section Writing an online manual. To find out more about GitHub Pages see https://pages.github.com/.
19.2. Travis CI as a service in the cloud
Travis CI is a build service in the clould that is free to all open source projects. It integrates well with GitHub. A new build is triggered on every push to your repository.
The following bit’s and pieces are needed:
-
Hook up http://travis-ci.org/ to your repository.
-
Add a file
.travis.ymlto the root of the repository. In our case this indicates to Travis that we want to use Ruby. -
Add a file
Gemfileto the root of the repository to specify the dependencies of Asciidoctor. -
Add a file
manual/build.shto the project to copy images in the proper place, and run asciidoctor. -
Add a file
manual/update-gh-pages.shto store the created Asciidoctor output to the repositories GitHub pages branch.
You can see the current status of the build here: https://travis-ci.org/ahus1/hystrix-examples.