Visualizing metrics with Grafana
A user can access metrics on pre-built Dashboards in Grafana and use them for ad hoc reporting.
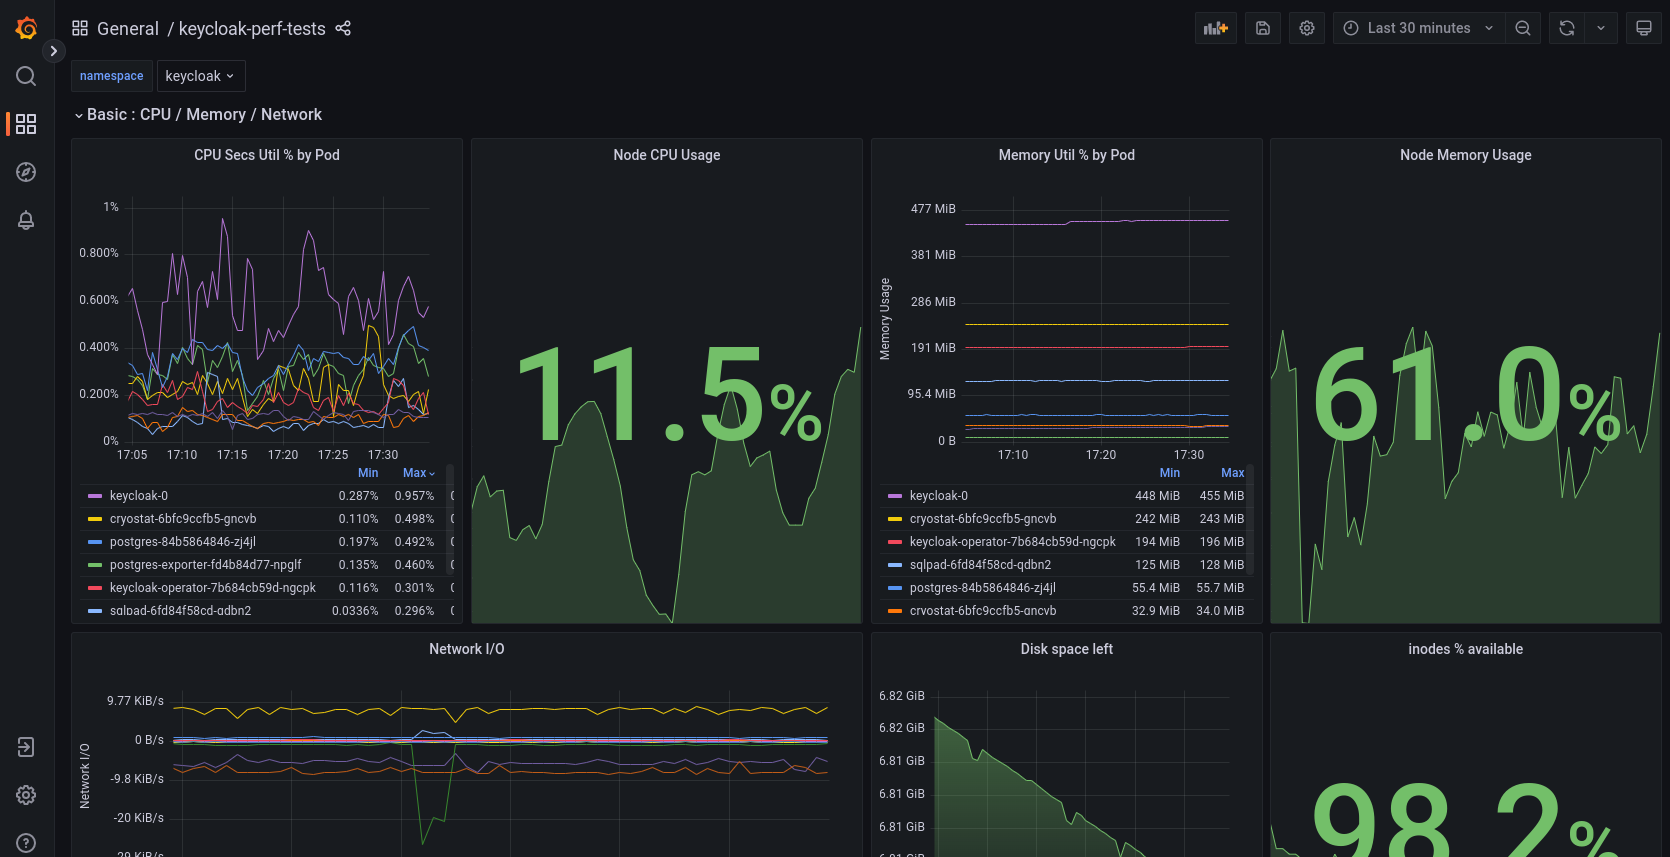
About Grafana
Grafana provides browser-based dashboards.
Visit the Grafana website for more information.
A user can access metrics on pre-built Dashboards in Grafana and use them for ad hoc reporting.
Grafana provides browser-based dashboards.
Visit the Grafana website for more information.